

To all of you that are new here – welcome to Fantasy Games Won 2023! Fantasy Games Won (FGW) is the both the name of a metric I invented in 2021 (officially, anyway) and an accompanying series of blog posts I started up at the same time.
Well, series of videos as well. As of today I am live on YouTube!
There are some small tweaks to the metric this year. But before I get into those, let’s recap on what this metric is trying to do and how it accomplises that goal.
I described this once back in 2021 on launch, but I will do what’s new here.
Why Do We Need Fantasy Games Won?
Imagine you have 3 players. They each play the same position – we’ll say WR. They all scored 40 points over a 5 week stretch.
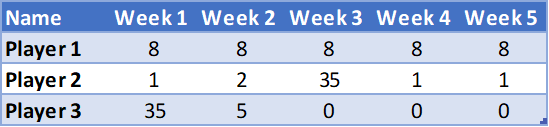
Generally, when looking back on previous seasons, we use points as a proxy for how well a player did. By that measure, each of these players hit the same mark. But their impact on their respective fantasy teams was remarkable different.
It’s time to bring in the concept of a bell curve. In a fantasy football matchup, your opponent will have an expected number of points they will score. With what I believe is the most common and kind of the average scoring system (0.5 point PPR, 1 QB, 2 RB/2WR and 1 Flex), the average team scored around 109 points per game from 2021-2022. Beyond that, there is a range of possible outcomes:
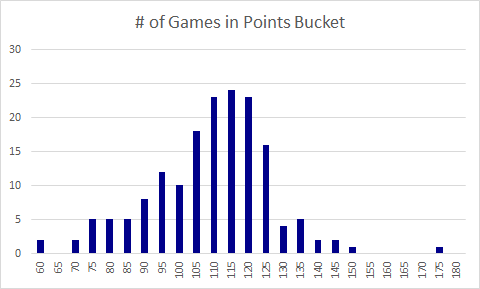
The above chart is a season’s worth of data for one very normal fantasy league. It follows a bell curve closely enough that it’s fair to use a normal curve and standard deviation value to summarize what your fantasy opponents will do.
The standard deviation of fantasy team score is about 17.4. This means that your chance of beating your opponent follow the normal curve:
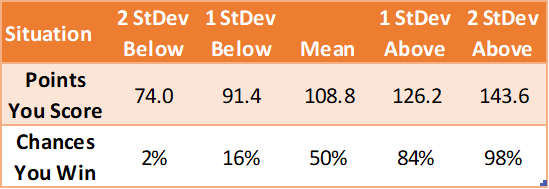
So, how does this come back to the players?
If you assume all else is equal, as in you and your opponent have average players in all positions, one player’s scoring versus the mean at his position can be placed on this chart. Just to be on the nose here, a player scoring 17.4 points more than the average for his position means he has increased your chances of winning a week from 50/50 to 84%. Again, all else being equal.
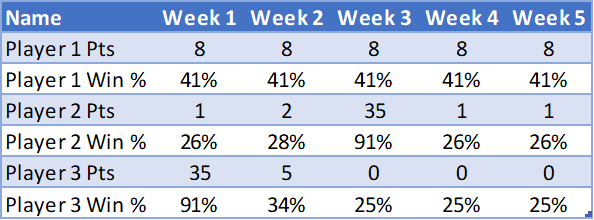
So the players above have the following impacts on your % chance of winning…assuming they were in your starting lineup. The average points scored for a WR is 12.
So is that it? Not quite…
Predictability Matters
There’s an important nuance that separates the players 1, 2, and 3 above that I haven’t shared yet.
Player 3 got hurt in Week 2. Out for the year. That’s why he scored 5 and then 3 straight donuts.
Players getting hurt sucks about as badly as anything can suck as a fantasy manager. But what doesn’t suck about an injured player is you know they’re not going to play.
Fantasy Games Won considers this point by reducing the scored impact a player has on your team based on the % chance he’s actually in your starting lineup.
Let’s apply this to our trio of fantasy assets:
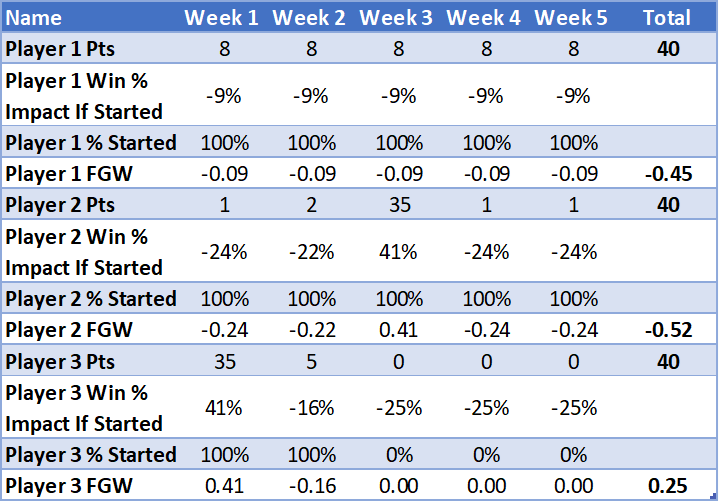
You can see from this:
- When you score points matters. None of these players were great overall, but Player 1 hurt his team less (-0.45 FGW) than Player 2 (-0.52 FGW) simply by scoring his 40 points in a different way.
- Whether the player scores when you expect him to matters a lot, too. Player 3 actually helped his team (+0.25 FGW) because his bad weeks were avoidable. He would have had a similar score to Player 2 if you had trotted him out every week.
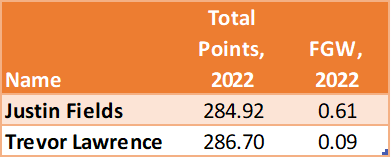
Want a real life example of this? Here’s a cool one:
That was Fantasy Games Won 101. This is more than enough to follow the column this year. Keep reading, however, if you feel like this isn’t enough.
That’s The 101? What’s The 411?
There are a number of challenges that come from measuring FGW, especially over the course of a season.
CHALLENGE #1 – Percent Started Data
It’s tough to capture percent started using real data. In Week 4 of 2021, Christian McCaffrey was injured. There was no reason to start him. And yet, using Yahoo! percent started data, he was still started 12% of the time across that fantasy universe.
You could use expert ranks to approximate Percent Started, but expert ranks don’t update when a player gets hurt in warmups – only actual percent started data will.
What I do is take the more extreme of the two measures. Whichever is farther from 50% – either rankings-predicted percent started or actual percent started – is the answer.
SOLUTION – Use A Combination of Start Data And Positional Ranks To Get Real Percent Started
CHALLENGE #2 – Comparing to Hypotheticals vs. Actuals
One of the criticisms I’ve had for FGW is best framed with the following Reductio Ad Absurdum:
Say all the starting RBs in a given week score 40 points. Does that mean they all had good weeks, or did they all have average weeks?
I have the metric structured for the former. Best way I can explain it is, the metric is meant to show how much a player improves your chances of winning by his performance alone. The point is not to measure whether you actually won.
SOLUTION – Compare to hypotheticals
CHALLENGE #3 – The Three Costs Problem
Fantasy players pay their owners by increases their chances of winning the championship.
Fantasy owners “pay” for these through 3 different “costs”:
- Starting Lineup (opportunity cost – by starting one player over another, you’re forgoing the opportunity for the other player to help you)
- Roster Spots (opportunity cost, similar to starting lineup – holding a player on your bench means you can’t get the benefit of someone else.
- Draft Capital (higher pick used on a player, high cost)
Starting Lineup is already accounted for. It’s the whole point of the metric.
Roster Spots are difficult. Part of the challenge here is figuring out how much a roster spot is actually worth in terms of what options it gives you to help your starting lineup. I don’t think the cost of using up a roster slot is huge, but it’s not zero cost. I am open to ideas here.
Draft Capital is also difficult, but I believe I may have solved it…
The Derrick Henry Situation
It’s Week 8 of the 2021 NFL Season
To that point the fantasy season was the Cooper Kupp and Derrick Henry shows. Then, the guy I kept referring to as a Terminator gets hurt.
My recap for week 8 was titled “Eight Games of Derrick Henry Was Worth a Top 3 Pick“. The accompanying discussion on Reddit raised a lot of questions, centered around this:
How many wins was Henry costing his owners by not being available weeks 9-17?
He would not directly impact those games – so his impact via the traditional FGW calculation would be zero.
I want to consider this in Season-Long FGW ranks. I’ve made a few attempts at this, with a “dFGW” stat and a “sink factor” to accompany FGW.
But this year, I think I’ve finally cracked the code.
Here’s the fix, which is a concoction of other attempted fixes I’ve tried before.
- When calculating impact for season-long FGW, the “average” score for a fantasy position (e.g. WR at 12) should be adjusted for ADP. This is different than adjusting FGW for ADP. It’s like one of those dumb order of operations math problems that we see on Facebook all the time, except there’s more to it than an intentionally ambiguous division symbol.
- For the percentage of time a player is not started, you input a replacement player’s expected score.

Without getting into the nitty gritty of how to do this, here’s how it would look:
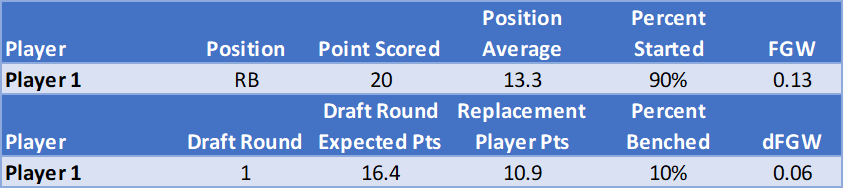
SOLUTION: Redo dFGW to account for draft position in the “impact” calculation.
Alright, Let’s Get Started!
I hope you follow along as we track this metric for 2023! Since this is really a backwards-looking metric, it has limited utility as a “get ready for the upcoming week!” tool (though it helps to quantify the frustration of inconsistent players and perhaps value them better).
If you want to support the blog, I have data for sale! Weekly ranks and percent started data takes time to mine so I’ve done it for you. Also I will be posting each week’s data for $1 as we go. I won’t have the FGW calculations in there – those are subject to change, and I need to play something close to my chest – but the raw data will be there.
Good luck in Week 1!

12 thoughts on “Don’t Use Points To Judge Fantasy Football Value – Fantasy Games Won Launch 2023”